Please Don't Go
- Oct 12, 2023
- 17 min read
Updated: Feb 21, 2025

September 2023 Newsletter
“Please don’t go”
The early 1990’s were an interesting time of change in England. For people under the age of 25, shell suits were a part of too many wardrobes, and playing with the new Nintendo Game Boys brought freedom from the old consoles. The Happy Mondays, Charlatans and the Stone Roses brought the acid music sound to life. London real estate was renewed as the first commercial buildings at Canary Wharf were occupied. In politics, Margaret Thatcher, the “Iron Lady” finished her run on Downing Street. If Thatcher was looking out her car window as it sped away on that final day (there were no smart phones after all), she likely would have seen many For Sale signs. While we could go on about British history, we’re here to discuss another UK product that can be known for the highs and lows, the country’s housing market. The early 1990’s were a bleak period for the UK economy, and the housing market felt much of that pain (see below). Today, the UK suffers from high inflation that doesn’t seem inclined to be tamed by the increases in rates from the Bank of England. Many worry that the UK housing market could have a similarly dark run to that of the early 90’s. We’d like to explore the specifics of the UK housing market, and whether we’re due for a retrospective feeling. When will things return “Back to Life”, as British group Soul II Soul sang in 1992? And will the listed UK housebuilding stocks still be around to enjoy it? Could the UK consumer backdrop share more with the US counterpart than many would realize?

We are told that housing is always local. And this makes sense. Since the UK has a population of roughly 67 million people, it is helpful to explain the nuances of the market in the context of some other markets like the United States. See below. The UK has had a shortage of land available for residential property development, and this has meant that the land underlying properties has been a dear (and appreciating) asset.

Source: Office of National Statistics
What has been detailed in tome after tome, study after study (Barker review 2004[1]) over many years is that the UK does not build enough housing. See chart below where the often quoted target of 300k homes has basically not been reached since the 1960’s. The 2nd chart below shows Annual Housing Completions over the size of the population for the UK, Canada and the USA, and you can see that for more than 30 years the UK has not produced meaningful new housing. The blame for this typically puts the most weight on the long planning process that is, of course, dictated by local policies and permitting. See third chart below. In some of the most popular areas for people to live, according to a report from Christian Hilber of the London School of Economics, the UK was rejecting more than 40% of potential residential developments before 2008. We don’t have an updated statistic, but my guess is that the % has gone up meaningfully since 2008. Taylor Wimpey CEO, Jennie Daly, recently was quoted as saying planning delays were now the worst she had known them “for 30 years”. The Institute for Fiscal Studies says that the per capita spending on housing planning services in the UK had dropped by 59% in the decade running up to 2019/20, and that there was no other government service that had experienced such cuts.

Source: Crest Nicholson

Source: Office of National Statistics, Federal Reserve Economic data, U.S. Census, Statistics Canada

Source: Impact of Supply Constraints on House Prices in England, Christian Hilber, London School of Economics
We can confirm this with global studies. See below. The OECD studied the links between residential investment and economic activity, and basically the UK has not reacted to strong GDP growth with an upswing in residential investment since the late 1980’s. In the second table below, you can see that the UK has responded to downturns with a reduction in residential investment (three downswings since the last upturn). Note that the United States has had Upswings and Downswings, meaning that the U.S. has a more normal housing supply reaction function.

Source: OECD

Source: OECD
Having established that land is scarcely available and difficult to permit for a residential investment in the UK, how does this impact the housing market? From the table below you can see that more UK citizens own their home outright than in many other markets. (Only Italy is higher in this table). And the % of people owning a home with a mortgage on it is a smaller % than the U.S., Canada, and Australia. When it comes to renters, the quirk is that very few people rent on the private market. Most rent with some form of government assistance.

Source: OECD
The UK does have a listed housebuilding sector, which not all countries do. Just a few of these builders are large enough to fit on the scale of U.S. housebuilders. For example, there are six housebuilders in the UK that completed more than 5k houses in their latest year (source: Housing Today). The United States has nineteen such developers (source: Builder). What is a greater challenge for UK housebuilders is that they must hold larger amounts of land for a longer time than would be typical in the U.S. In the two tables below, you can see that U.S. housebuilders carry lower amounts of inventory on their Balance Sheet relative to current year’s sales (first table is United States, second is the UK). This means that there is more risk and reward in the Balance Sheet of a UK housebuilder.

Source: Factset

Source: Factset
UK housebuilder’s land banks can be measured in numbers of years (see chart below). In a steadily rising market, land secured many years before will run through the income statement at a high margin. Consider for a moment the ongoing predicament of western economies for the last two years, inflation. These large books of land sitting on the Balance Sheet of UK housebuilders should provide protection in these times, as scarce land should hold its value relative to a depreciating currency like the British Pound. Alas, housebuilders are operating entities with labor costs, administrative costs, etc… They have to produce enough cash in a given year to cover these costs, or they will not be around for the day when the tremendous land values can be crystallized. And that’s the way it played out all the way back in the early 1990’s. Many UK housebuilders went bust. UK investors have a long memory for that period.

Source: Housebuilding Market Study: Response to Statement of Scope
Eventually, people buy homes. Housing is a consumer discretionary purchase. Having a healthy market for new housing units involves employment, affordability, mortgage credit, etc…And this is where market watchers feel that the current timeframe rhymes with the experience of the time when the band Oasis still performed music together. The mood in the UK economy has been poor. Much of this has to do with inflation (see below). The UK was hit especially hard when Russia invaded Ukraine. On top of this is an extra amount of negativity that UK market forecasters seem to have for their home economy. London is a global financial center, and many of those that travel to work every day feel more gloomy about what directly surrounds them than the markets they may cover elsewhere. Given it is a financial center, this message spreads wide, and then next thing you know, everyone is negative on the UK economy. Funny how we never hear as much gloom about Germany!

In order to buy a house, new or old, one must be for sale. And this is why many in the United States look at so called “inventory data”. This compares the amount of existing homes for sale to the number of recent transactions, and communicates the output in monthly terms. The United States, for example, currently has about 3.3 months of houses available for sale (source: Federal Reserve). This is a historically low figure, and as a consequence, it has provided an opening for U.S. housebuilders to fill the vacuum with new units. Given the lack of supply, these U.S. housebuilders can dictate prices. In the UK, however, housing supply as expressed by homes available for sale, is higher. See below. The natural question is, who is selling? The normal course sellers are caused by death, divorce, moving location and or financial distress. The first three reasons do not suddenly elevate, and there is little sign of household financial distress as the unemployment rate is very low (see 2nd table below). People in the UK have every reason to feel insecure about inflation, but if they have a job, they probably feel secure in that job. And the strongest reason for consumers to feel anxiety about their economic future is if they are worried about losing their job. Most people in the UK have little reason to feel that anxiety.

Source: House of Commons library

Source: Office of National Statistics
My guess is that an increase in listings have come from sellers that are “opportunistic”. According to JP Morgan, since 2007 UK house prices have soared 44% in the UK, and by 74% in London. And a large proportion of the sellers today are in the Southeast of England (including London), where property prices have not only gone up by the highest %, but also stand at much higher absolute levels. Now that the market feels softer, and mortgage rates have jumped, why not get out if you can? And within the Southeast of the country, nearer to London, there are more “Buy to Let” property owners. “Buy to let” is exactly what it sounds like, becoming a landlord. According to Paragon, 18.1% of UK mortgages are for “Buy to let”. These properties have an important role in the market because otherwise there wouldn’t be enough rental properties for those that cannot afford to get on the housing ladder. (We noted earlier that the private rented market is small in the UK; the Financial Times 10/6/23 issue mentioned that the number of UK properties to rent is at a 14 year low) According to the Financial Times, a recent survey suggested that private landlords are now twice as likely to sell as to buy. There was also the greater influence of foreigners with their vacation or speculative homes in this part of the country. (Homes and Country did a study that found there were 17,055 Russian owned properties in the UK, and 1,895 Russian owned properties in London alone) Of course, if the reason for your purchase was financial, it makes sense for the reason to sell to be the same. We can’t prove it, but we believe the “opportunistic” sellers are out there.
There is another unique UK factor that could be bringing sellers onto the market, specifically of apartments (or flats as they call them). As a consequence of the Grenfell Tower[2] fire from a few years ago, regulators and lawmakers have passed a number of measures to make sure that buildings are upgraded to make them safer. This is a daunting task. The Financial Times estimated that we are talking about more than 800k apartments in the UK. There was previously mass confusion about who was to pay for these fixes. The newly passed Building Safety Bill (passed in April 2023) aims to provide clarity. Some were stuck with previous costs, and or were unable to sell before or re-mortgage before, as for a time banks were not lending without a fire safety signoff. It has been a mess for the apartment owner market. Now with the market financing freed up by the clarity, there are more apartments on the market.
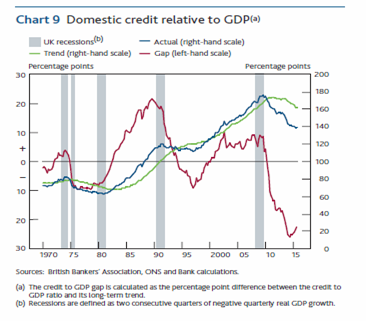
Studies on housing (Duca/Muellbauer/Murphy[3], Mian and Sufi[4]) have found that the prime determinant of house prices is not affordability, but credit conditions. The most specifically important metric that can be found is the LTV expected of a first time home buyer. A second important requirement is for sound regulation of banks. Back in the early 1990’s, the UK made a dog’s dinner of regulating its smaller banks. Basically they didn’t monitor them, and the banks grew too fast. The Bank of England had to provide emergency assistance to small banks, but during the drama, 25 small UK banks failed over four years. See below. Today, we have the Prudential Regulation Authority monitoring banks in the UK, and credit, as you can see below, has been falling relative to GDP for some time.
Source: Bank of England
The improved regulation has born fruit, and UK banks are in solid shape, even against a severe stress test scenario. See below. And this likely explains why mortgage rates for relatively high LTV loans are coming down in rates over the past few months. See 2nd chart below. The market is now more calm in the UK relative to last year when bonds spiked with the Liz Truss mini budget fiasco. Yes, the property market is cool. But the credit availability that is vital for keeping house prices from plummeting into a crisis, as in the early 90’s, is there.

Source: Bank of England

Source: Nerdwallet
U.S. economic performance has been better than that of the UK. As we mentioned earlier, doom and gloom has surrounded the UK economy. But while we do not have strong views on the next move for the U.S. economic surprise factor, we believe that the UK has turned a corner. The latest reading of the Citi UK economic surprise index is positive, at 9.3. This means that more economic data that is coming out has been better than expected. This measure has been positive for several months now. Just this last week, the UK Government revised Q1 UK GDP up by 0.2% points. Unlike the US consumer, the UK consumer still has their excess savings. See below. And in the 2nd chart below, you can see that if inflation falls as is expected, very soon the UK consumer will have a positive gap between pay and inflation. We’ll have to see on that; economic forecasts are usually wrong. UK retailers are experiencing strength at the moment. Next, JD Sports, DFS, Marks and Spencer have all made positive reports on the marketplace in the last two months.


Much has been said about the fact that U.S. mortgage holders are going to hold onto their cheap mortgages dearly. This clearly limits the impact of monetary policy on the U.S. economy, and can explain the resilience that we have witnessed. See below, where the actual U.S. outstanding mortgage rate has actually below 4%, essentially a whisper higher than the lowest level of the last twenty years. In the second chart below, you can see the outstanding mortgage rates for UK mortgage holders. The effective rate is lower than that of the United States, at roughly 3%, but it has been rising significantly since the beginning of 2022. Our view is that both the U.S. and UK economies share their economic insensitivity to rates rising. But we believe that the lag is much stronger here in the United States. The U.S. reassurance has kept housing off of the market. What happens when it starts appearing? And remember, a smaller % of property owners in the UK have a mortgage at all.


Source: Bank of England
In the United States, despite higher mortgage rates, optimism about housebuilders is strong as reflected in share price performance. Over the last six months, US housebuilder equities have strongly outperformed the U.S. equity market. See below, an Index of Builders is up 57% over the past year. This is in very strong contrast to the UK equity market, where housebuilders are very much on the avoid list. Now, the situation is different. U.S. housebuilders have earnings estimates that are going up. In the UK, they have been coming down. See 2nd chart below where the blue line is US housebuilder shares in the last six months and the yellow line are the shares of UK housebuilders.

Source: Factset

Source: Factset
Given weak sentiment on the cycle, UK housebuilders are trading on Balance Sheet valuation. Price to NAV or Book Value is the driver. And currently the UK housebuilders sit, in aggregate, at 0.8x Price/Book Value. See below. And while it is irrelevant to us at Ballina that US housebuilders sit on a much higher ratio (the blue line below), we do want to make the case for sentiment improving with UK housebuilders, and how that could help these share prices. We surmise that just a little bit of that positive earnings cheer enjoyed by U.S. housebuilders is going to make it’s way across the Atlantic to their UK peers.

Source: Factset
As for the UK companies that we follow, we are more particular to Vistry, Berkeley Group and Crest Nicholson. See the table below. They’re each unique. Berkeley Group focuses on the more expensive Southeast of England. The bear case for Berkeley is that London’s affordability is awful, and their market is pretty much the weakest in the UK at the moment. What we like about Berkeley is : a) the strong track record of financial performance through the cycles, b) the Net Cash on the Balance Sheet together with 58k plots of land that their internal assumption hold as eventually having a Gross Margin of 7.9bn GBP, and c) margin and profit expectations are low. Crest Nicholson (“CRST”) is more geographically diverse, and is quite a bit smaller. The bear case is clear – if the market has a 1990’s or GFC like period, then CRST may not make it to the upcycle as banks and shareholders would be unlikely to save the company from its cash operating burden. We would agree that CRST is a riskier play, and you have to be comfortable with UK macro risk because history tells you that the smaller players pay a heavier price in a downturn. There are many things to like about CRST: a) strong balance sheet, b) history of strong free cash flow generation, c) low margin expectations relative to what seems reasonable that CRST can achieve, and d) due to the depressed share price, a very strong discount versus historical valuation ranges. Finally, Vistry is unique because it focuses on the Partnership segment. This is a unique but growing segment of the market that works with public authorities and other capital providers to bring forward projects with a combination of private rental, government subsidized affordable housing and private market housing all on the same development. These Partnership projects accelerate cash return to Vistry, and leads to higher overall Returns on Capital for the business. The bear case is that the company has execution risk in selling off some of their land plots that do not fit with their pivot to focus 100% on the partnerships model. While Vistry is not as cheap as CRST, we like the resilience of their operating model to economic conditions, and we believe the market is far from discounting successful execution of their strategy.

The vital piece to keeping the UK housebuilders from exacting a terrible price on their shareholders will be their financial strength. See the LT Debt/Equity for the sector. It is as low as it has been in any recent time period. Basically the sector is prepared for things to get quite a bit worse, and for the upcycle to take its time returning.

Source: Factset
In conclusion, we are positive on the UK housebuilders. We like their (illiquid) land holdings in a market where land that can be developed is scarce, and housing has been structurally under supplied. We are comfortable with their ability to remain liquid enough to make these land holdings meaningful. We’re comfortable with UK macroeconomic situation, and prepared to let the data and what we see convince us otherwise, as opposed to the opinions or views of market commentators. A large part of our comfort emanates from the tightness of the labor market. No one likes having to spend more for services, but the most vital factor is people having jobs. With a strong job market, and scarcity of rental properties, the houses for sale on the market will eventually clear. The Labor party may regain control of the Government in the next election, and if they have any influence at all, it will be to increase housing volumes, and therefore increase liquidity. As always, it is our responsibility at Ballina to remain risk aware and risk averse. We have used our sell discipline on UK specific stocks before, and we would use it again if the situation starts to look more toxic than we expect. History may rhyme, but need not repeat. They say that one of the trends in the UK in 2023 is that consumers second hand shop in reaction to inflation. Hopefully the early 90’s playbook remains on the rack.
Strategy Performance
International All Cap Value returned -0.74% on a gross basis, and -0.81% on a net basis, in September 2023 versus -3.40% for the benchmark. Year to date performance was 8.39% on a gross basis, and 7.61% on a net basis, versus 5.42% for the benchmark.
International Small Cap Value[5] returned -0.71% on a gross basis, and -.79% on a net basis, in September 2023 versus -4.26% for the benchmark. Year to date performance was 6.07% on a gross basis, and 5.31% on a net basis, versus 4.74% for the benchmark.
International Developed Market Value[6] returned -1.28% on a gross basis, and -1.36% on a net basis, in September 2023 versus -3.65% for the benchmark. Year to date performance was 0.53% on a gross basis, and 0.38% on a net basis, versus -4.94% for the benchmark.
International Developed Market Small Cap Value[7] returned -0.08% on a gross basis, and -0.15% on a net basis, in September 2023 versus -4.58% for the benchmark. Year to date performance was -4.47% on a gross basis, and -4.60% on a net basis, versus -7.88% for the benchmark.
Top Contributors and Detractors
International All Cap Value’s top contributor in September was Galliford Try, which returned more than 19% for the month. The UK construction company reported positive YE results, and reiterated that medium term targets are on track. The stock carries a very high dividend yield at the moment, partly due to a special dividend due to be paid in October. The strategy’s top detractor was Centerra Gold, which declined more than 18% in the month. This is a Canadian gold producer, and the sector has struggled as confidence has firmed around stronger for longer interest rates in the United States.

International Small Cap Value’s top contributor in September was Galliford Try, which returned more than 19%. The UK construction company reported positive YE results, and reiterated that medium term targets are track. The stock carries a very high dividend yield at the moment, partly due to a special dividend due to be paid in October. The strategy’s top detractor was Hengan International, which declined more than 11% for the month. This is a personal care company based in China. The company reported first half results, and these were negatively impacted by wood pulp raw material costs, impacting the tissue segment.

International Developed Market Value’s top contributor in September was Galliford Try, which returned more than 19%. The UK construction company reported positive YE results, and reiterated that medium term targets are track. The stock carries a very high dividend yield at the moment, partly due to a special dividend due to be paid in October. The strategy’s top detractor was Linamar Corp, which declined slightly more than 8% for the month. This is a Canadian auto/industrial suppler. There was no company specific news. The stock is likely reacting to general stock market weakness related to macroeconomic fears for North American economies.

Disclosures:
The opinions expressed herein are those of Ballina and are subject to change without notice. Past performance is not a guarantee or indicator of future results. Returns are presented gross and net of fees and include the reinvestment of income. The benchmarks being shown for comparison purposes are: a) for International All Cap Value - the Vanguard Total International Stock ETF (VXUS), b) for International Small Cap Value - Vanguard FTSE All-World ex-US Small-Cap ETF (VSS), c) for International Developed Market Value – the iShares MSCI EAFE ETF (EFA), and d) for the International Developed Market Small Cap Value – the iShares MSCI EAFE Small-Cap (SCZ) . The information contained herein is not investment advice. The information contained in this commentary represents the opinion of Ballina Capital and should not be construed as personalized or individualized investment advice. You should not consider the information and commentary published herein as a recommendation to buy or sell any particular security. The securities identified and described do not represent all the securities purchased, sold or recommended for client accounts. You should not assume that any of the securities discussed in the commentary published herein are or will be purchased for your account, or are or will be profitable, or that recommendations we make in the future will be profitable or equal the performance of the securities listed in commentary. Consider the investment objectives, risks, and expenses before investing.
For the Top and Bottom Contributors: Contribution reflects the impact of performance and the portfolio weight to total portfolio return. Data show is from a representative account of the International All Cap Value and International Small Cap Value. All returns are Gross of Fees. Timing differences of purchases and sales may have a modest impact on the actual contribution numbers presented. The calculation methodology along with detail on all holding’s contribution to the overall accounts performance during the measurement period are available upon request.
[1] The Barker Review of Housing Supply was published in March 2004. Economist Kate Barker presented recommendations to the UK Government for securing future housing. [2] On June 4, 2017, the 24 story Grenfell Tower burned, and 72 people died. The fire was accelerated by an exterior combustible composite cladding. Since the tragedy, the Government has updated safety measures, and initiated funding for fixing older buildings that are susceptible to fire risk. [3] John V. Duca, John Muellbauer, Anthony Murphy. 2011. House Prices and Credit Constraints; The Economic Journal. Volume 121, pages 533-551 [4] Atif Mian, Amir Sufi. 2009. Household Leverage and the Recession of 2007 to 2009. 10th Jacque Polak Annual Research Conference [5] On October 17, 2022, the Global Small Cap Value strategy transitioned to the International Small Cap Value strategy. From this date forward the focus of the strategy will be on International Small Cap stocks. The benchmark changed on 10/17/22 to Vanguard International FTSE All-World ex-US Small-Cap ETF (VSS). [6] International Developed Market Value is a new composite. The strategy funded during June of 2023, and July 2023 was the first full month of performance. [7] International Developed Market Small Cap Value is a new composite. August 2023 was the first full month of performance.


Comments